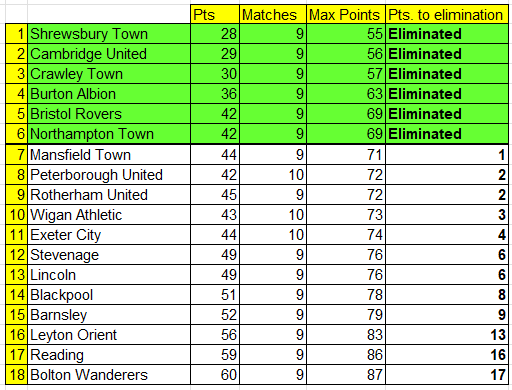
Teams who can't catch us & Points to elimination

I was doing a thread like this in 19/20 and it got messed up by Covid, so apologies in advance for WW3.
Not tempting fate, just showing who can't catch us and how many points are needed to eliminate each of the current non-playoff teams. Obviously we can gain 6 points on anyone maximum if we both play, and even this weekend we will gain on some of these without playing owing to dropped points throughout the division.
I will keep this updated for a larf.
12
Comments
I thought Gaz would stabilise the Shrews but never had them down for top
Nice to know we can’t be relegated at least!
Here is a companion to it also - all seasons where we finished above L1 relegation zone. I will put our current season on points for now till we know finishing position. We only need to come 5th for our third most successful season, and will certainly end up top 5 either way.
Until it turns out Lommy really was money laundering and we get a 30 point deduction
As long as the Man City precedent applies it won't be judged for another 15 years by which time the average gasroom age will be 70+
Think we’ve had a few funny run ins over the last few months @Shev but it’s nothing personal. I can be a bit of a hot head after a few misplaced passes and pints. Very pleased you’re back posting again. I love the idea for this thread. Thanks for sharing.
No worries mate! I had genuinely already forgotten anything like the proverbial goldfish. Cheers to you!
Thanks Shev. I love good stats and this is both fun and useful to see develop.
I've made a form spreadsheet that I've been putting on Bluesky for this season too. Can see the clear form peak of October and November and then the drop off.
Hope this is of interest.
Cheers @Atomic! This is great!
I should add this is league matches only. 🤣 Probably important to state that. I felt it was the most fair data set to use.
Does the green on the graph represent the time Morley was at the club?
On his row yes. It really helps his PPG value that he missed the first 2 matches.
On the PPG graph as the top red is 0-1, orange 1-2 and green 2+. The divisions aren't perfectly matching the values, but close enough to be representative.
Ah those late autumnal days when we all thought we’d score 3+ goals a game and average 2 points per game forever.
Also, ‘The Morley Factor’, yikes.
Love the charts, thanks @Shev, glad you are back. Thanks @Atomic too.
Give it a couple of years and Morley will have reached almost Messi levels in people's memories!
Quite possibly. Myself and a few others still talk about Steven Taylor’s impact and he was only here for about four games!
I'm very bored, just some useless stats given Shev's excellent table.
Today's useless stat after 31 games - W/D/L Record in Kit for League games only
Quarters: P 28 - W: 15 D: 9 L: 4. Win Rate: 53.57%
Green: P 3 - W: 1 D: 1 L: 1. Win Rate: 33.33%
Red: P 6 - W: 4 D: 1 L: 1. Win Rate: 66.67%
More concerning is that I have been to multiple home and away games this season and Wycombe winning when I'm attending is at 12.5% which basically means I should not watch Wycombe play live. In fact, I've only seen Wycombe win one game this year (in the league) and that was the dreadful game against Crawley.
Optas latest predicted end of season table
"0.73 points ahead, you'll never sing that"
Another good reason to hate the green kit.
Up the Pete!!!
and
Up the Stock!!!
The thought of it all coming down to the last game of the season is making me feel physically sick already.
And then waiting to see if Reading still exist to work out the final points....
A win against Lincoln would already mathematically guarantee a top half finish with eight games to go!
Seems incredible that Mansfield are effectively already eliminated considering how successful they were for the first half of the season.